


Diversification Wins: Protecting Your Retirement Nest Egg


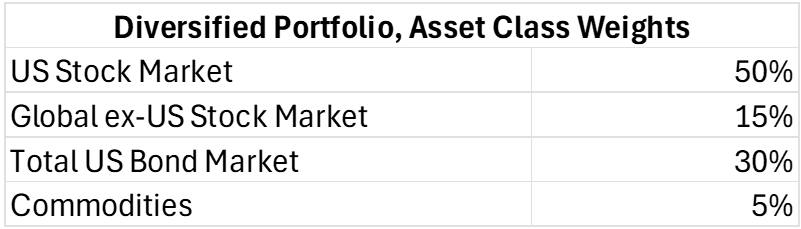
It’s our job as wealth managers to be prudent stewards of capital. This includes understanding the complexities of portfolio risk and its impact on a client’s retirement plan. The portfolio that worked for you in your 30’s may not work as well for you in your 60s. Today’s post will highlight the retirement portfolio’s need for diversification and its ability to reduce key retirement risks. We will compare two portfolios and their ability to provide income in retirement. The first portfolio consists of 100% US equities. The second portfolio is considered “diversified” and consists of 4 asset classes (US and non-US equities, US bonds and commodities).
Before we get started, let’s define a few terms.
Sequence of return risk: the risk of market declines in the early years of retirement, coupled with periodic withdrawals, significantly reducing the longevity of a portfolio. E.g. Mike Smith retires in 2022, the beginning of a 18-month bear market in stocks & bonds. Withdrawals from Mike’s financial assets are required in the early years of retirement. The timing of the withdrawals and decline in asset prices will increase the risk of Mike running out of money in retirement.
Monte Carlo Simulation: A mathematical model used for risk assessment. Approximates the probability of certain outcomes by running multiple trial runs, called simulations. The simulation will calculate the percentage probability of specific scenarios based on set assumptions. The method is used in retirement planning to project the likelihood of achieving goals, and whether a retiree will have enough income given a wide range of potential market outcomes.
Max Drawdown: The maximum observed loss (peak to a trough) of a portfolio through its life.
To compare the ability of each portfolio - we will run a Monte Carlo simulation. We begin by defining our asset class return assumptions. Expected returns are based on published long-term capital market assumptions from several asset managers. It’s important to note, the expected return for US stocks (+8%) is much less than the historical average (+10.5% from Jan 1972 to Dec 2023, source AQR).

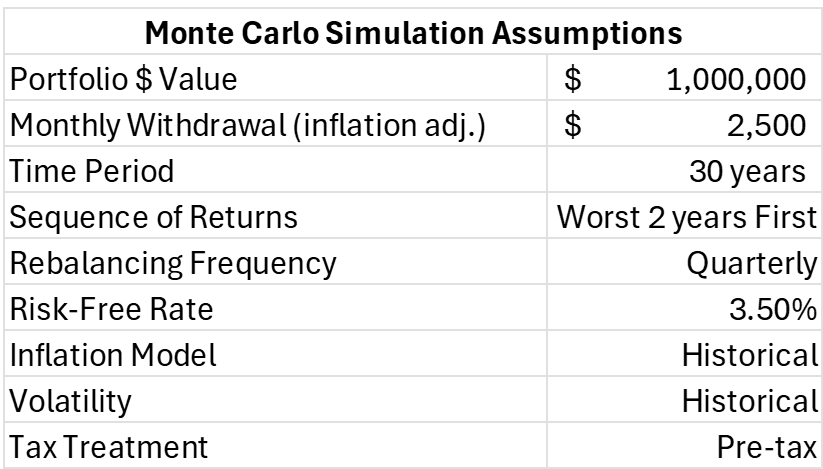
Next, we define the simulation assumptions. A monthly withdrawal of $2,500 will continue for 30yrs adjusted for inflation. To account for sequence of return risk, the worst generated yearly returns will be used for the first 2 years of the experiment. The diversified portfolio will be rebalanced quarterly, ensuring asset class weightings stay on target and there is continuity of risk and expected return.
After running 5,000 trials for each portfolio - below are the results of the simulation. The probability of the Diversified Portfolio lasting 30 years is 82% while the probability of the pure US equity portfolio is only 56%. This is despite the higher average return of +8.0%. By including 3 additional asset classes, the volatility and max drawdown was reduced. This enabled the portfolio to weather the storm in years 1 and 2 of retirement and capture less downside. Volatility, once the investor’s friend during the accumulation stage is now enemy #1 in retirement.

This simple yet powerful experiment highlights the retiree’s need for portfolio diversification. Owning assets that behave differently through stages of the cycle is an effective and proven way to protect capital. Diversification is truly the only (semi) free lunch available to investors!
The projections or other information generated by this Monte Carlo simulation regarding the likelihood of various investment outcomes are hypothetical in nature, do not reflect actual investment results and are not guarantees of future results. There is no guarantee that the results generated by this simulation will be achieved or sustained, and results may vary with each use and over time. Actual results vary with each use over time and may be better or worse than those previously generated. The results do not constitute investment advice or recommendation, are provided solely for informational purposes, and are not an offer to buy or sell any securities. All indices are unmanaged, and investors cannot invest directly into an index. Unlike investments, indices do not incur management fees, charges, or expenses. Past performance does not guarantee future results. This material is intended for informational/educational purposes only and should not be construed as investment advice, a solicitation, or a recommendation to buy or sell any security or investment product. Please contact me for more information specific to your situation.
Asset Class Data Sources
US Stock Market: AQR US MKT Factor Returns 1972-1992 (AQR Data Sets), CRSP US Total Market Index 1993+
Global ex-US Stock Market: AQR Global ex US MKT Factor (AQR Data Sets) 1986-1996, MSCI ACWI Ex. USA Index 1997+
Total US Bond Market: Bloomberg US Aggregate Bond TR Index 1987+
Commodities iShares S&P GSCI Commodity Index 2007+
 | A guest post by
|